Response latency
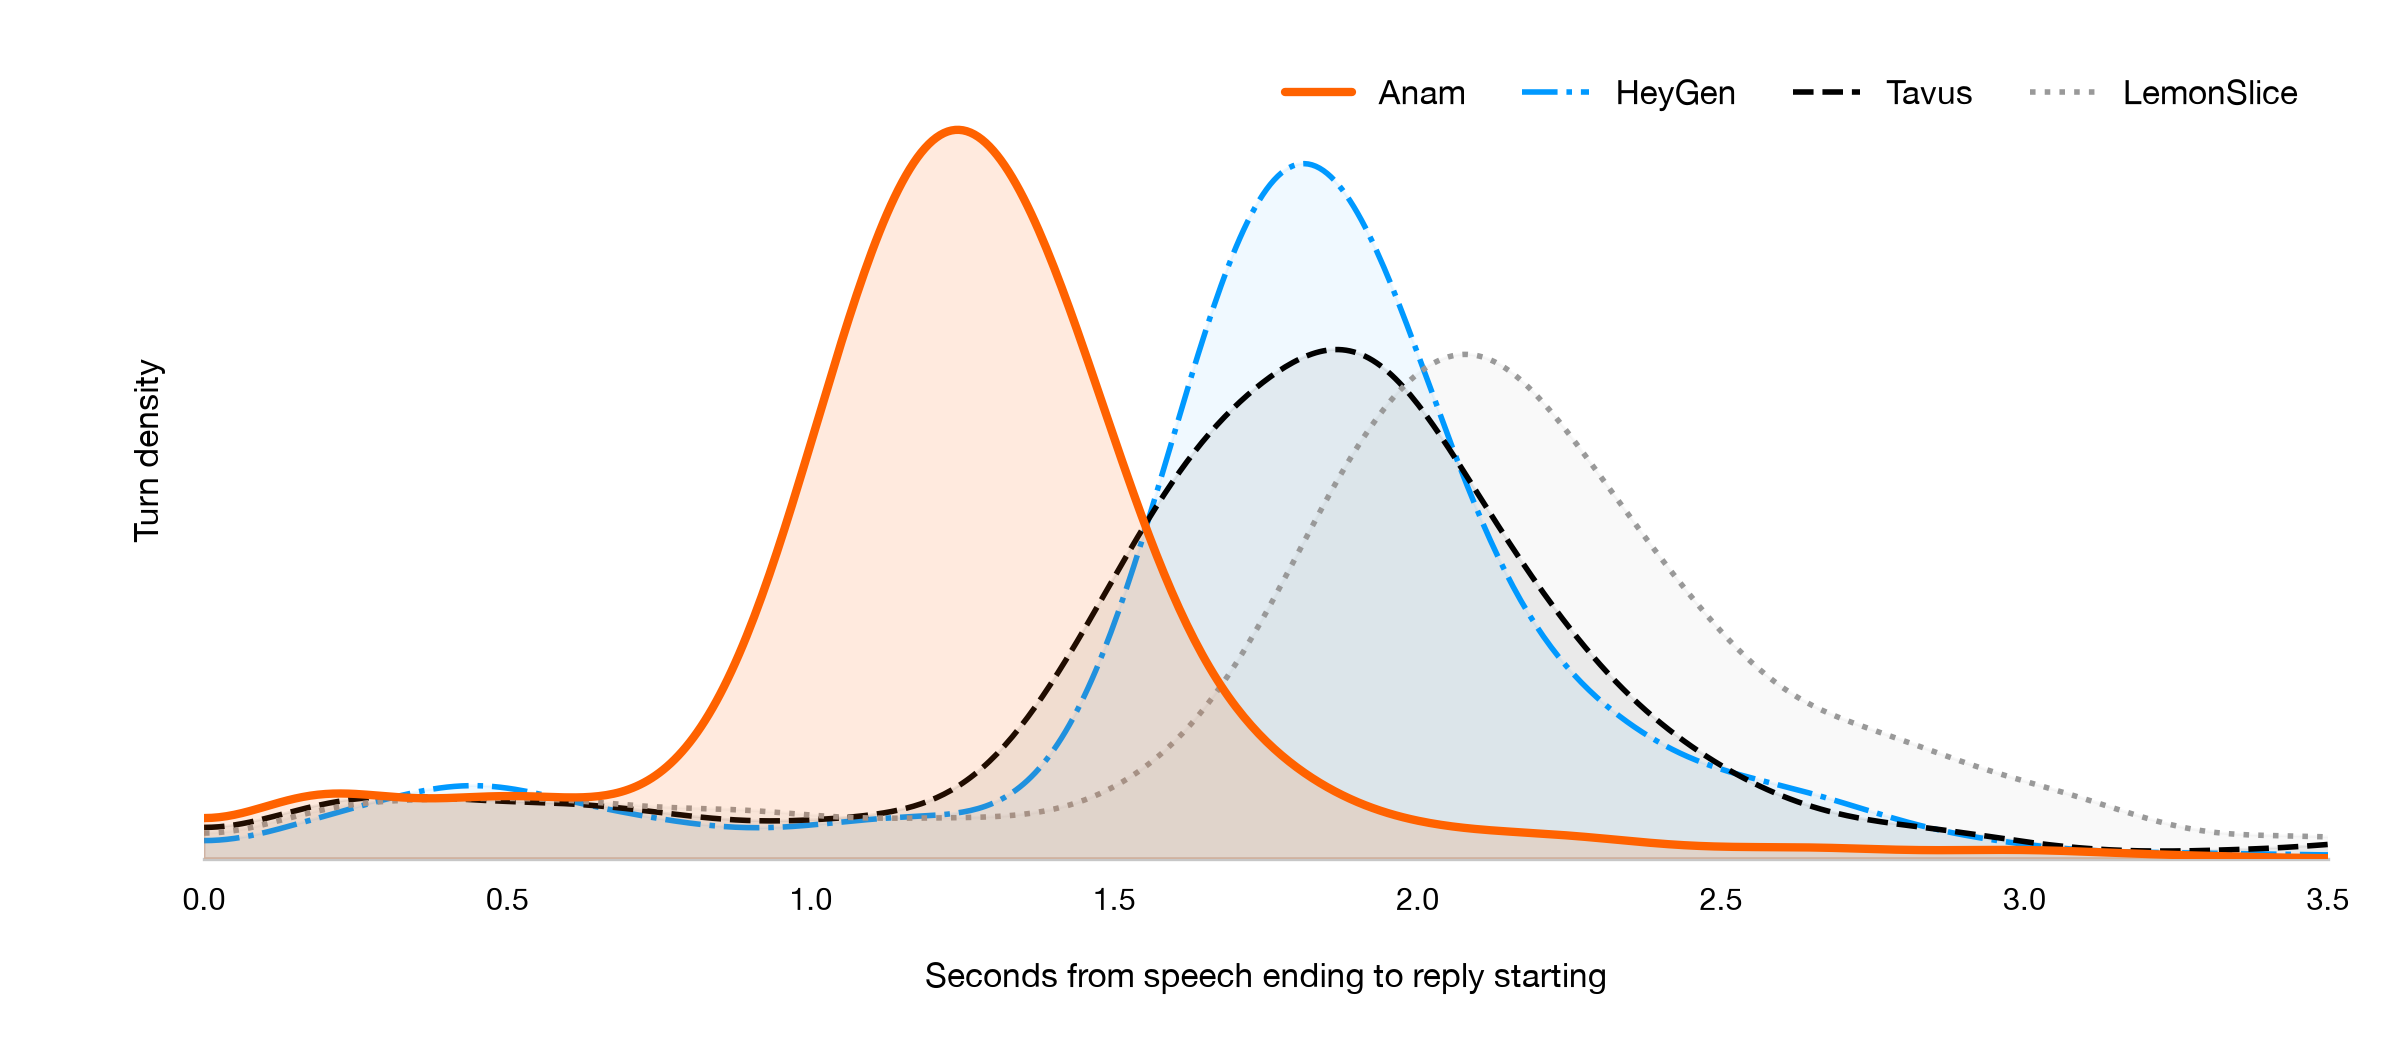
Time from the user finishing speaking to the avatar starting its reply. Measured from the two audio channels of each browser-captured recording, using the same method for every provider.
Sixty people each held sixteen conversations across Anam Cara-4.1 Express, HeyGen, Tavus phoenix-4.5 and LemonSlice: 960 rated conversations. We measured response latency and connection time across each provider’s full pipeline, with competitors running their defaults.
1.24sAnam median response latencyAbout 0.6s quicker than HeyGen
1.42sAnam median connection timeAbout 2.2s quicker than HeyGen
Providers’ full pipelines
Response latency is the time from the user finishing speaking to the avatar starting its reply, measured from audio recordings captured in the rater’s browser in the same way for every provider. Anam’s median was 1.24s, compared with 1.82s for HeyGen, the next quickest provider.
This is end-to-end latency as experienced by the user, including transcription, language-model processing, speech and avatar generation, and network time between the rater’s machine and the provider’s server. Raters were geographically varied, primarily across Europe and North America.
Providers’ full pipelines · Lower is better
Median is the middle measured time. P90 and P95 are the times at or below which 90% and 95% of replies fell.
| Rank by median | Vendor | Median | P90 | P95 | Turns over 3s | Measured turns |
|---|---|---|---|---|---|---|
| 1 | AnamCara-4.1 Express | 1.24s | 1.62s | 1.84s | 0.5% | 1,173 |
| 2 | HeyGenVendor default | 1.82s | 2.30s | 2.52s | 0.8% | 1,240 |
| 3 | Tavusphoenix-4.5 | 1.86s | 2.52s | 3.62s | 6.4% | 1,118 |
| 4 | LemonSliceVendor default | 2.10s | 2.78s | 3.06s | 5.9% | 1,172 |
Over 90% of Anam’s responses were faster than the closest competitor’s median response time.
Providers’ full pipelines
Connection time, or time to first frame (TTFF), runs from pressing Start to the first visible avatar video frame, including the provider’s session-creation API call. Anam’s median was 1.42s, about 2.2s quicker than HeyGen at 3.66s.
P95 and P99 are the times at or below which 95% and 99% of connections completed. Counts below are measured connections, rather than conversation turns.
| Rank by median | Vendor | Median | P95 | P99 | Measured connections (n) |
|---|---|---|---|---|---|
| 1 | AnamCara-4.1 Express | 1.42s | 2.97s | 4.55s | 231 |
| 2 | HeyGenVendor default | 3.66s | 7.57s | 12.30s | 229 |
| 3 | Tavusphoenix-4.5 | 5.00s | 9.92s | 23.31s | 233 |
| 4 | LemonSliceVendor default | 9.72s | 14.41s | 19.86s | 233 |
The table includes all 926 measured connections. The study included 960 rated conversations overall.
October 16, 2026
Anam
Cara-4.1 ExpressHeyGen
Vendor defaultTavus
phoenix-4.5LemonSlice
Vendor defaultIn this separate study, 60 people held 1,200 rated conversations with the same speech-to-text model, language model and text-to-speech model across providers. Only the avatar provider changed.
The shared pipeline used Deepgram Nova-3 as the speech-to-text model, Groq-hosted GPT OSS 120B as the language model and Cartesia Sonic-3.6 as the text-to-speech model.
Synthesia is included here because it uses a customer-supplied speech-and-language pipeline. This is a like-for-like comparison of that setup. The full-pipeline and LiveKit studies are reported separately because their configurations differ.
Providers’ avatar models on LiveKit
Anam’s median response latency was 2.12s and Synthesia’s was 2.20s. The paired comparison within each participant did not establish a response-speed advantage over Synthesia.
Shared LiveKit pipeline · Lower is better
| Rank by median | Vendor | Median | P90 | P95 | Turns over 3s | Measured turns |
|---|---|---|---|---|---|---|
| 1 | AnamCara-4.1 Express | 2.12s | 3.50s | 3.64s | 35.3% | 1,230 |
| 2 | SynthesiaVendor default | 2.20s | 3.68s | 3.80s | 34.7% | 1,240 |
| 3 | Tavusphoenix-4.5 | 2.46s | 3.88s | 4.11s | 38.0% | 1,187 |
| 4 | HeyGenVendor default | 2.58s | 3.90s | 4.08s | 40.7% | 1,151 |
| 5 | LemonSliceVendor default | 2.70s | 4.12s | 4.26s | 42.3% | 1,134 |
These 5,942 measured turns use the same response-latency definition as the full-pipeline study. The shared speech-and-language pipeline was slower than Anam’s own: 35.3% of Anam replies and 34.7% of Synthesia replies took over three seconds.
Providers’ avatar models on LiveKit
Anam’s median connection time was 2.76s, compared with 3.44s for Synthesia, the next quickest provider. Anam connected fastest for 55 of the 59 participants who reached all five providers.
| Rank by median | Vendor | Median | P95 | P99 | Measured connections (n) |
|---|---|---|---|---|---|
| 1 | AnamCara-4.1 Express | 2.76s | 4.32s | 5.22s | 245 |
| 2 | SynthesiaVendor default | 3.44s | 5.30s | 8.34s | 243 |
| 3 | HeyGenVendor default | 3.63s | 9.32s | 10.74s | 239 |
| 4 | Tavusphoenix-4.5 | 5.03s | 6.60s | 7.48s | 242 |
| 5 | LemonSliceVendor default | 5.36s | 9.00s | 20.14s | 242 |
All 1,211 measured connections use the same Start-to-first-visible-frame definition. P95 and P99 show the 95th and 99th percentiles of connection time.
October 16, 2026
Anam
Cara-4.1 ExpressSynthesia
Vendor defaultHeyGen
Vendor defaultTavus
phoenix-4.5LemonSlice
Vendor defaultThe main benchmark used 60 participants and 960 rated conversations, with each provider running its full pipeline. Anam used Cara-4.1 Express; competitors ran their defaults. The separate LiveKit study used 60 participants and 1,200 rated conversations on a shared speech-and-language pipeline.
Time from the user finishing speaking to the avatar starting its reply. Measured from the two audio channels of each browser-captured recording, using the same method for every provider.
Time from pressing Start to the first visible avatar video frame, also called time to first frame (TTFF). Measured from client connection events, including the provider’s session-creation API call.
The median is the middle measured time. P90, P95 and P99 describe the slower end of the results: 90%, 95% and 99% of measurements fall at or below those times.
The full-pipeline results include 4,703 measured turns and 926 measured connections; the LiveKit results include 5,942 turns and 1,211 connections. A conversation can contain several turns. Counts reflect the measurements available for each metric and are separate from the number of rated conversations.
Response tables show the median, P90, P95 and the share of replies taking over three seconds. Connection tables show the median, P95 and P99. The two studies are presented separately because their pipeline configurations differ.
Measured on October 16, 2026. These results describe the configurations tested on that date. Products and performance can change.
The benchmark repository includes the methodology, evaluation code, de-identified ratings, session telemetry and provider configurations, so you can inspect the setup and reproduce the results.
Anam conducted this benchmark, and we recognise the conflict of interest in comparing our own product with competitors. The figures above use the study report’s published precision. Full-pipeline and LiveKit results are presented separately so each comparison reflects the configuration tested.
For human ratings of lip sync, visual quality, naturalness and conversational experience, see the avatar quality benchmark.
Get started with Anam’s real-time avatar API.